
Tushita’s Annual Report 2018
December 2018
Each year as we complete the season, we are eager to crunch the numbers to see how our experience of success translates into numbers and graphs. Our 2018 season running from February to November has proven once again that interest in Tibetan Buddhism continues to grow, as does our ability to meet it! (See Figure 1.)
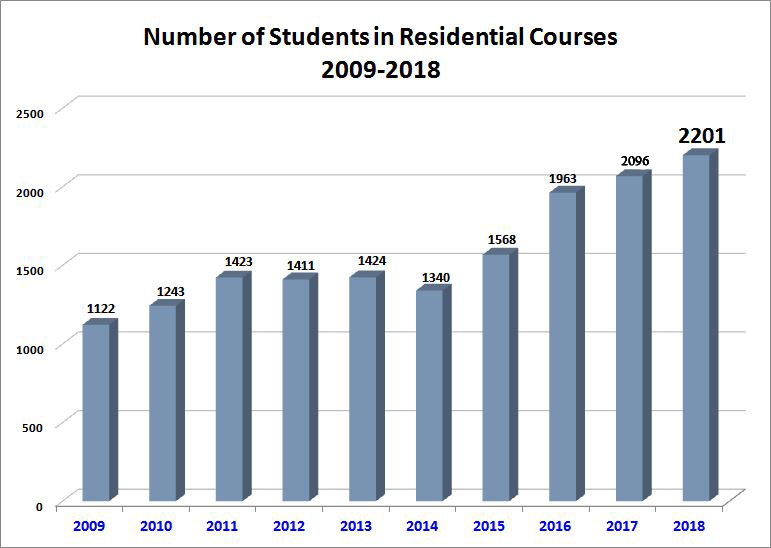
Figure 1. Total residential course attendance each year from 2009 to 2018.
As Table A. displays, this year we hosted 16 Introduction to Buddhism courses, a special introductory-level course with Geshe Lhakdor, 8 intermediate/advanced courses, 7 group retreats, and our annual Pre-ordination course!
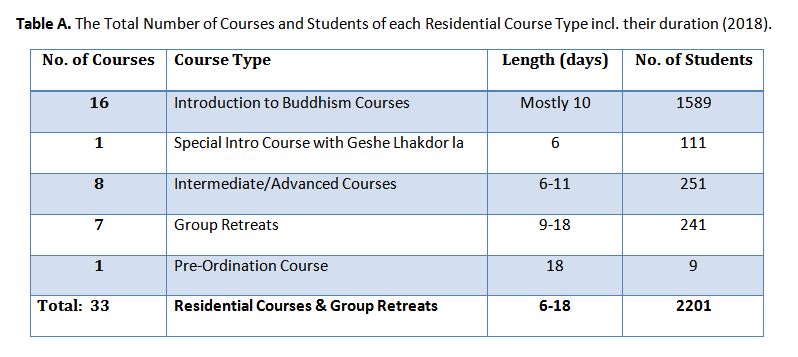
All these residential courses and retreats were attended by 2,201 students – a new Tushita record!! ???
This was made possible by our increasingly effective determination to get as many students who wish to meet the Dharma into our courses.
Again, most of our courses had long waiting lists and once more our most numerous student nationality was India.
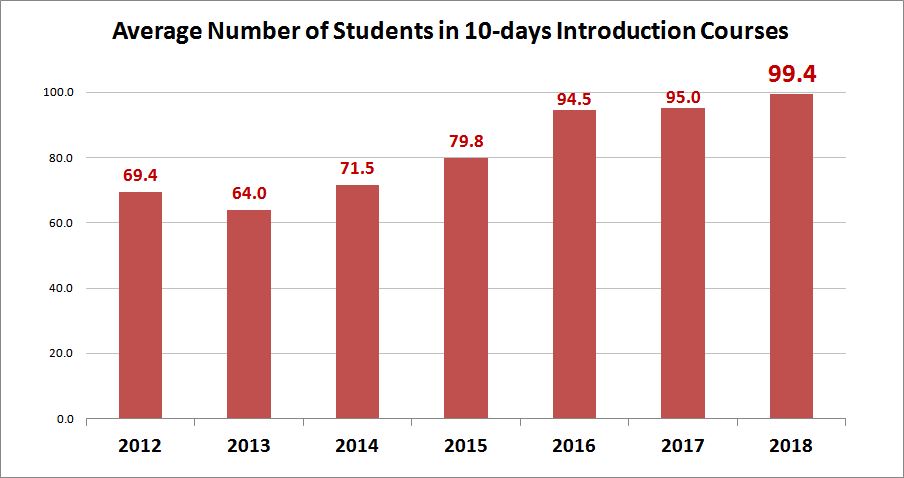
The increased interest of students combined with our determination to accommodate them resulted in our highest average yet for our Introduction Course attendance: 99.4 students per course!
You can see the growth progression of these popular courses over the past seven years in Figure 2 below.
This year we supplemented our schedule with an additional 10 short courses. These were non-residential courses from 2 – 4 days in duration which attracted a total of 840 participants! With such a response we are encouraged to host more next year to meet the interest.
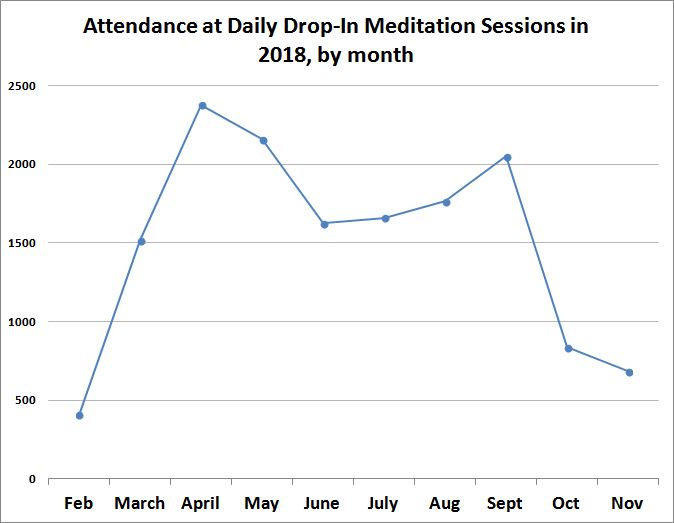
Our daily drop-in meditations continued to be a huge hit with visitors this year. (See Figure 3 below). Our very conservative estimate of total attendance for 2018 is 15,079! This number is lower than last year due in part to our many short courses and running three simultaneous residential courses (during which time we suspended morning meditations- time to build a fourth gompa!), as well as several public audiences with His Holiness, and our admittedly incomplete record-keeping for morning attendance. Whatever the actual total number was, the sessions themselves were seen as a success, and the gompa was regularly filled to the brim. We even had to set up a speaker so that those who could only find seating outside the meditation hall could still participate! Our highest single day attendance was May 8th with 150 visiting meditators! We rejoice.
In addition to these regular offerings, we welcomed uncounted visitors to our many special guest teachings throughout the year such as His Eminence Ling Rinpoche’s second initiation in as many years at Tushita. This year His Eminence offered the White-Tara Long Life initiation which was a tremendous success. To see the beautiful photos from this and all our other amazing special events, please see our December 2018 Newsletter.
But who are these people who come on Tushita courses?
Who are our Indian Students?
We are so happy to welcome so many Indian students to our courses. Over the last 10 years the interest in Buddhism by Indians has increased tremendously. The graph below demonstrates this steady growth in interest.
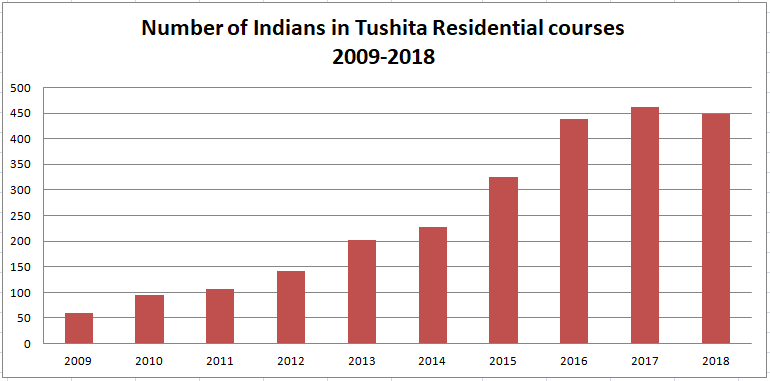
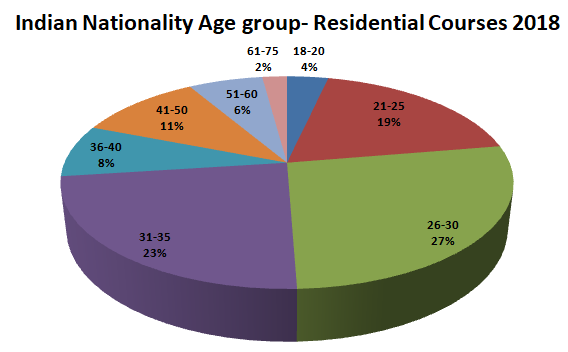
The majority of our Indian students are young adults, with 50% between the ages of 26 and 35. This suggests to us that more Indians today are taking time at an earlier age (rather than waiting until their later years) to explore their spirituality. We rejoice in this new prioritization as we believe the fruits of these internal efforts will improve the quality of all their subsequent years.
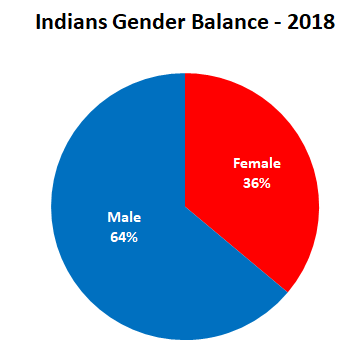
As the pie chart below reveals, almost 2/3 of our Indian students are male. Women gained a little more ground this year compared to last: a 2% increase.
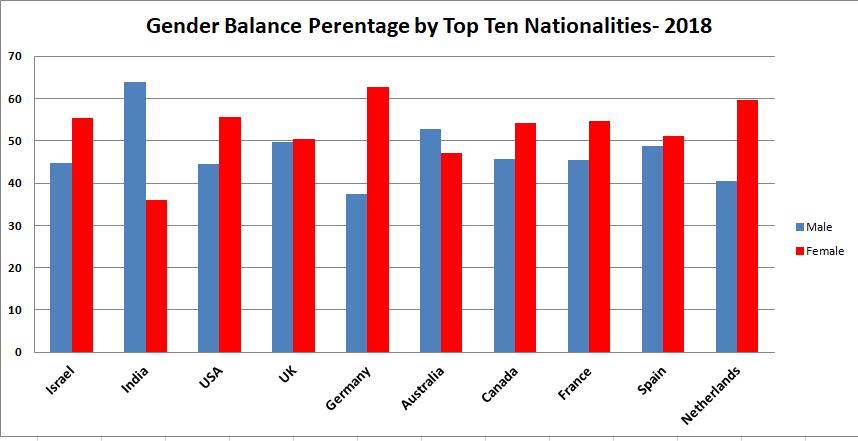
The graph below shows the gender balance of our top ten nationalities in 2018. Interestingly, we have more female students compared to male among every country with the sole exception of India. We hope to welcome ever-more Indian women and men in the years to come!
Where are Tushita’s Students from?
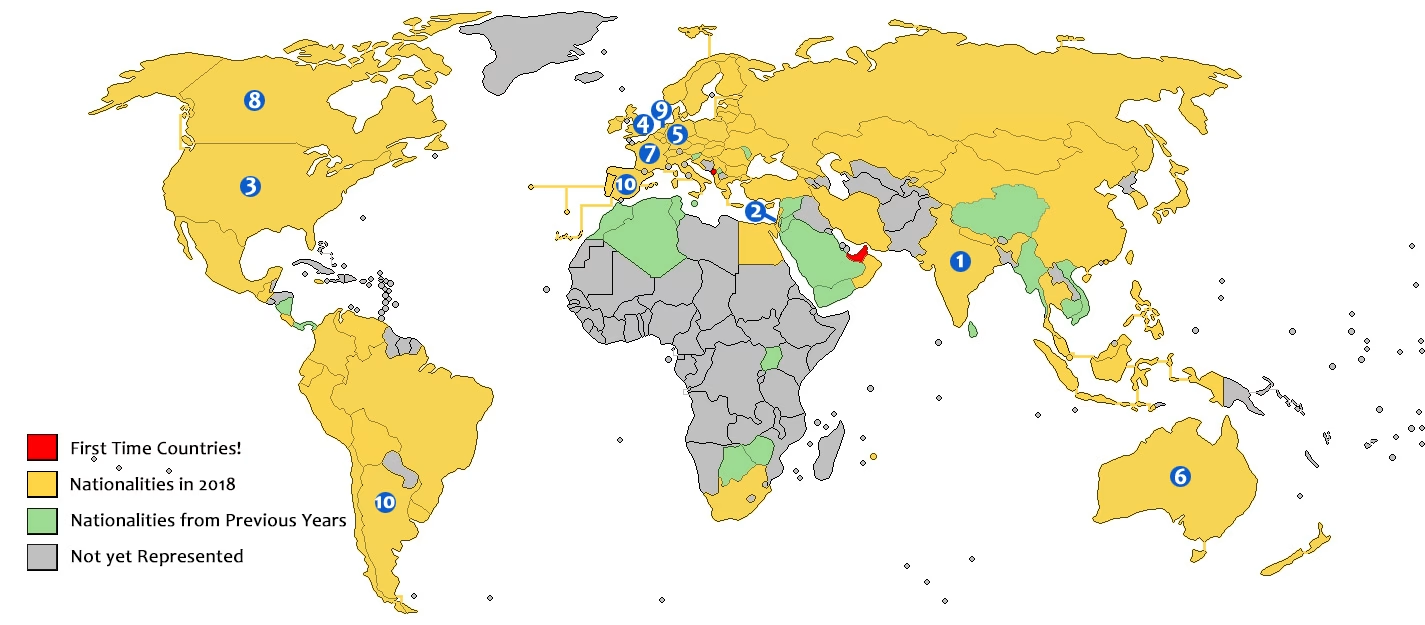
As of 2018 we have now had students in our residential courses from 99 different countries! This year we were happy to welcome students from Montenegro and the United Arab Emirates for the first time!
In Table A you can see a list of the top ten nationalities represented in our residential courses in 2018. (Figure 3 below shows these countries highlighted on a world map.)
If you would like to see the full list of 99 countries, please click here. See if your country is represented. If not: come, we need you!
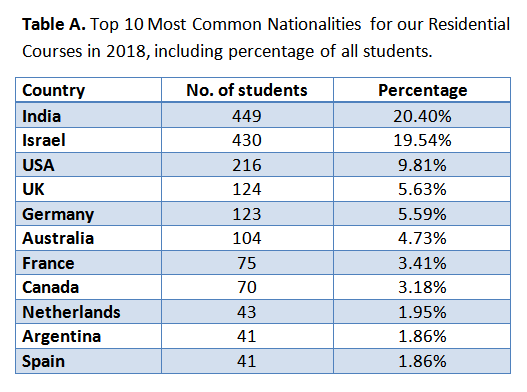
This year Canada and Australia swapped places from last year at #6 and #8. Spain – not one to stand around and be kicked off the Top Ten list for long (2017) – made a comeback tying for 10th place with a brand new contender: Argentina! This is the first time Argentina has appeared on our Top Ten, jumping from 15th place last year. Brazil did not see this coming, and was short by just two students for a shared spot at #10.
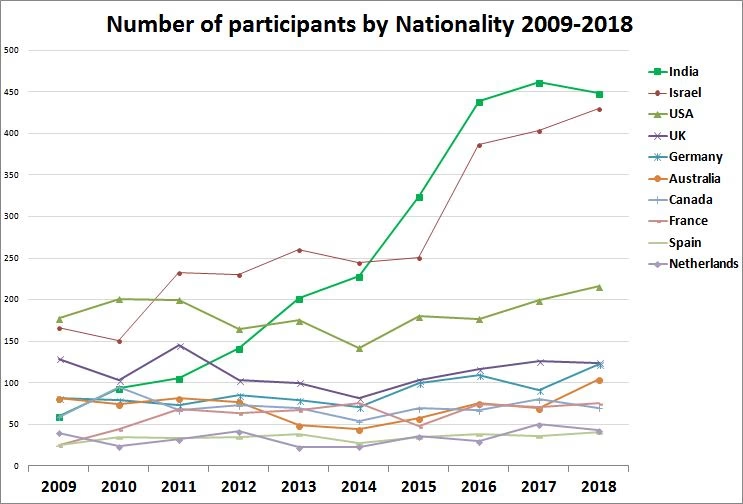
Figure 2 (below) gives historical perspective by showing national trends. One of the most significant changes we’ve noticed over the past 10 years is the shift in national patterns of participation, primarily – The Rise of India! This year, with a slight reduction in Indian attendance combined with a record-breaking number of Israeli students, Israel is giving India a run for the title once more! Last year India had a lead of 58 students over Israel; this year there was a difference of only 19!
Will Israel playfully wrest it’s Tushita crown back from India in 2019? Come join us and find out!
Full list of countries in 2018
| # | Citizenship of Residential Course Students | 2018 | % From 2009-2018 |
| 1 | India | 449 | 20.40% |
| 2 | Israel | 430 | 19.54% |
| 3 | USA | 216 | 9.81% |
| 4 | UK | 124 | 5.63% |
| 5 | Germany | 123 | 5.59% |
| 6 | Australia | 104 | 4.73% |
| 7 | France | 75 | 3.41% |
| 8 | Canada | 70 | 3.18% |
| 9 | Netherlands | 43 | 1.95% |
| 10 | Spain | 41 | 1.86% |
| 11 | Argentina | 41 | 1.86% |
| 12 | Brazil | 39 | 1.77% |
| 13 | Italy | 35 | 1.59% |
| 14 | Russia | 31 | 1.41% |
| 15 | Mexico | 30 | 1.36% |
| 16 | Switzerland | 29 | 1.32% |
| 17 | New Zealand | 23 | 1.04% |
| 18 | Austria | 21 | 0.95% |
| 19 | Colombia | 19 | 0.86% |
| 20 | Sweden | 17 | 0.77% |
| 21 | Ireland | 17 | 0.77% |
| 22 | Poland | 16 | 0.73% |
| 23 | Chile | 15 | 0.68% |
| 24 | Belgium | 14 | 0.64% |
| 25 | Denmark | 12 | 0.55% |
| 26 | South Africa | 12 | 0.55% |
| 27 | Japan | 12 | 0.55% |
| 28 | Thailand | 11 | 0.50% |
| 29 | South Korea | 10 | 0.45% |
| 30 | Singapore | 10 | 0.45% |
| 31 | China | 8 | 0.36% |
| 32 | Portugal | 7 | 0.32% |
| 33 | Turkey | 7 | 0.32% |
| 34 | Czech Republic | 7 | 0.32% |
| 35 | Slovakia | 6 | 0.27% |
| 36 | Kyrgyzstan | 4 | 0.18% |
| 37 | Finland | 3 | 0.14% |
| 38 | Norway | 3 | 0.14% |
| 39 | Ukraine | 3 | 0.14% |
| 40 | Malaysia | 3 | 0.14% |
| 41 | Bulgaria | 3 | 0.14% |
| 42 | Indonesia | 3 | 0.14% |
| 43 | Iran | 3 | 0.14% |
| 44 | Luxembourg | 3 | 0.14% |
| 45 | Egypt | 3 | 0.14% |
| 46 | Guatemala | 3 | 0.14% |
| 47 | Mongolia | 3 | 0.14% |
| 48 | Romania | 2 | 0.09% |
| 49 | Hungary | 2 | 0.09% |
| 50 | Lithuania | 2 | 0.09% |
| 51 | Peru | 2 | 0.09% |
| 52 | Belarus | 2 | 0.09% |
| 53 | Nepal | 2 | 0.09% |
| 54 | Ecuador | 2 | 0.09% |
| 55 | Serbia | 2 | 0.09% |
| 56 | Kazakhstan | 2 | 0.09% |
| 57 | Cyprus | 2 | 0.09% |
| 58 | Albania | 2 | 0.09% |
| 59 | Taiwan | 1 | 0.05% |
| 60 | Estonia | 1 | 0.05% |
| 61 | Greece | 1 | 0.05% |
| 62 | Latvia | 1 | 0.05% |
| 63 | Mauritius | 1 | 0.05% |
| 64 | Venezuela | 1 | 0.05% |
| 65 | Croatia | 1 | 0.05% |
| 66 | Uruguay | 1 | 0.05% |
| 67 | Costa Rica | 1 | 0.05% |
| 68 | Philippines | 1 | 0.05% |
| 69 | Lebanon | 1 | 0.05% |
| 70 | Oman | 1 | 0.05% |
| 71 | Georgia | 1 | 0.05% |
| 72 | Jamaica | 1 | 0.05% |
| 73 | Bolivia | 1 | 0.05% |
| 74 | Hong Kong | 1 | 0.05% |
| 75 | Montenegro | 1 | 0.05% |
| 76 | UAE | 1 | 0.05% |
| 2201 | 100.00% |
All 99 countries that have participated in Residential Courses 2009-18
| # | Citizenship of Residential Course Students | 2009 | 2010 | 2011 | 2012 | 2013 | 2014 | 2015 | 2016 | 2017 | 2018 | Total 2009-2018 | % From 2009-2018 |
| 1 | Israel | 166 | 151 | 233 | 230 | 260 | 245 | 251 | 387 | 404 | 430 | 2757 | 17.49% |
| 2 | India | 60 | 94 | 106 | 142 | 202 | 228 | 325 | 439 | 462 | 449 | 2507 | 15.90% |
| 3 | USA | 178 | 201 | 200 | 165 | 175 | 142 | 180 | 177 | 199 | 216 | 1833 | 11.63% |
| 4 | UK | 129 | 103 | 145 | 103 | 100 | 81 | 103 | 116 | 126 | 124 | 1130 | 7.17% |
| 5 | Germany | 82 | 79 | 73 | 85 | 79 | 71 | 100 | 109 | 91 | 123 | 892 | 5.66% |
| 6 | Australia | 81 | 74 | 81 | 77 | 49 | 44 | 57 | 75 | 69 | 104 | 711 | 4.51% |
| 7 | Canada | 59 | 95 | 67 | 73 | 69 | 54 | 69 | 67 | 80 | 70 | 703 | 4.46% |
| 8 | France | 25 | 44 | 68 | 63 | 67 | 76 | 48 | 74 | 71 | 75 | 611 | 3.88% |
| 9 | Spain | 25 | 35 | 33 | 35 | 38 | 27 | 35 | 38 | 36 | 41 | 343 | 2.18% |
| 10 | Netherlands | 40 | 24 | 32 | 42 | 22 | 23 | 36 | 30 | 50 | 43 | 342 | 2.17% |
| 11 | Brazil | 10 | 18 | 15 | 25 | 15 | 26 | 24 | 33 | 40 | 39 | 245 | 1.55% |
| 12 | Sweden | 13 | 25 | 26 | 35 | 34 | 18 | 16 | 29 | 29 | 17 | 242 | 1.54% |
| 13 | Italy | 14 | 16 | 14 | 17 | 22 | 13 | 23 | 32 | 35 | 35 | 221 | 1.40% |
| 14 | Austria | 12 | 18 | 27 | 31 | 16 | 10 | 25 | 19 | 29 | 21 | 208 | 1.32% |
| 15 | Mexico | 17 | 21 | 19 | 24 | 14 | 10 | 9 | 23 | 21 | 30 | 188 | 1.19% |
| 16 | Argentina | 7 | 8 | 14 | 17 | 14 | 19 | 20 | 25 | 23 | 41 | 188 | 1.19% |
| 17 | Switzerland | 15 | 26 | 14 | 28 | 15 | 15 | 8 | 13 | 21 | 29 | 184 | 1.17% |
| 18 | Russia | 8 | 2 | 7 | 9 | 26 | 26 | 26 | 27 | 20 | 31 | 182 | 1.15% |
| 19 | Ireland | 19 | 16 | 22 | 16 | 14 | 15 | 10 | 20 | 19 | 17 | 168 | 1.07% |
| 20 | New Zealand | 18 | 20 | 12 | 6 | 11 | 8 | 11 | 16 | 19 | 23 | 144 | 0.91% |
| 21 | Belgium | 11 | 9 | 9 | 17 | 9 | 16 | 18 | 13 | 16 | 14 | 132 | 0.84% |
| 22 | Poland | 6 | 9 | 9 | 9 | 10 | 19 | 11 | 18 | 15 | 16 | 122 | 0.77% |
| 23 | Chile | 1 | 10 | 12 | 3 | 12 | 8 | 13 | 21 | 21 | 15 | 116 | 0.74% |
| 24 | Denmark | 15 | 10 | 16 | 13 | 10 | 8 | 7 | 6 | 14 | 12 | 111 | 0.70% |
| 25 | Colombia | 2 | 8 | 7 | 7 | 7 | 13 | 13 | 13 | 13 | 19 | 102 | 0.65% |
| 26 | Finland | 14 | 6 | 18 | 9 | 11 | 6 | 9 | 14 | 10 | 3 | 100 | 0.63% |
| 27 | South Africa | 9 | 4 | 5 | 7 | 12 | 9 | 14 | 14 | 9 | 12 | 95 | 0.60% |
| 28 | South Korea | 9 | 7 | 12 | 20 | 12 | 6 | 3 | 9 | 6 | 10 | 94 | 0.60% |
| 29 | Portugal | 6 | 1 | 15 | 9 | 15 | 3 | 6 | 11 | 13 | 7 | 86 | 0.55% |
| 30 | Japan | 11 | 6 | 11 | 8 | 11 | 4 | 5 | 4 | 6 | 12 | 78 | 0.49% |
| 31 | Turkey | 3 | 6 | 5 | 5 | 2 | 6 | 5 | 6 | 14 | 7 | 59 | 0.37% |
| 32 | Singapore | 2 | 10 | 7 | 7 | 1 | 1 | 7 | 1 | 6 | 10 | 52 | 0.33% |
| 33 | Czech Republic | 4 | 2 | 7 | 6 | 5 | 7 | 3 | 3 | 7 | 7 | 51 | 0.32% |
| 34 | Taiwan | 4 | 16 | 1 | 3 | 7 | 3 | 6 | 0 | 1 | 1 | 42 | 0.27% |
| 35 | Slovenia | 5 | 1 | 2 | 8 | 4 | 9 | 9 | 3 | 0 | 0 | 41 | 0.26% |
| 36 | Norway | 2 | 5 | 2 | 8 | 6 | 2 | 3 | 5 | 5 | 3 | 41 | 0.26% |
| 37 | Romania | 1 | 3 | 2 | 2 | 5 | 6 | 5 | 5 | 9 | 2 | 40 | 0.25% |
| 38 | Ukraine | 2 | 5 | 3 | 3 | 6 | 7 | 2 | 6 | 2 | 3 | 39 | 0.25% |
| 39 | China | 1 | 2 | 3 | 4 | 5 | 4 | 4 | 1 | 4 | 8 | 36 | 0.23% |
| 40 | Hungary | 2 | 6 | 2 | 3 | 4 | 6 | 3 | 3 | 2 | 2 | 33 | 0.21% |
| 41 | Slovakia | 3 | 7 | 5 | 0 | 0 | 5 | 3 | 3 | 1 | 6 | 33 | 0.21% |
| 42 | Thailand | 0 | 1 | 5 | 0 | 2 | 2 | 6 | 1 | 1 | 11 | 29 | 0.18% |
| 43 | Estonia | 5 | 1 | 10 | 2 | 1 | 1 | 2 | 4 | 1 | 1 | 28 | 0.18% |
| 44 | Vietnam | 6 | 0 | 1 | 3 | 3 | 3 | 0 | 3 | 8 | 0 | 27 | 0.17% |
| 45 | Greece | 5 | 4 | 1 | 3 | 1 | 5 | 3 | 2 | 0 | 1 | 25 | 0.16% |
| 46 | Tibet | 3 | 5 | 4 | 0 | 6 | 1 | 2 | 1 | 3 | 0 | 25 | 0.16% |
| 47 | Malaysia | 1 | 8 | 1 | 4 | 0 | 1 | 3 | 3 | 0 | 3 | 24 | 0.15% |
| 48 | Bulgaria | 0 | 0 | 2 | 0 | 3 | 2 | 3 | 5 | 4 | 3 | 22 | 0.14% |
| 49 | Lithuania | 1 | 0 | 2 | 5 | 0 | 2 | 4 | 3 | 2 | 2 | 21 | 0.13% |
| 50 | Indonesia | 0 | 5 | 10 | 0 | 0 | 1 | 1 | 0 | 1 | 3 | 21 | 0.13% |
| 51 | Latvia | 1 | 1 | 5 | 2 | 1 | 1 | 0 | 2 | 2 | 1 | 16 | 0.10% |
| 52 | Mauritius | 0 | 2 | 1 | 1 | 1 | 3 | 1 | 2 | 4 | 1 | 16 | 0.10% |
| 53 | Iran | 0 | 1 | 3 | 0 | 0 | 0 | 2 | 3 | 1 | 3 | 13 | 0.08% |
| 54 | Peru | 0 | 2 | 0 | 1 | 0 | 1 | 1 | 0 | 4 | 2 | 11 | 0.07% |
| 55 | Luxembourg | 4 | 0 | 1 | 2 | 0 | 0 | 0 | 0 | 0 | 3 | 10 | 0.06% |
| 56 | Malta | 1 | 0 | 2 | 1 | 1 | 2 | 1 | 0 | 1 | 0 | 9 | 0.06% |
| 57 | Belarus | 0 | 0 | 1 | 1 | 2 | 1 | 2 | 0 | 0 | 2 | 9 | 0.06% |
| 58 | Venezuela | 1 | 1 | 1 | 1 | 0 | 3 | 0 | 0 | 1 | 1 | 9 | 0.06% |
| 59 | Croatia | 0 | 0 | 0 | 0 | 0 | 0 | 1 | 5 | 2 | 1 | 9 | 0.06% |
| 60 | Uruguay | 0 | 1 | 0 | 0 | 1 | 1 | 0 | 2 | 2 | 1 | 8 | 0.05% |
| 61 | Nepal | 1 | 1 | 0 | 2 | 1 | 0 | 0 | 0 | 1 | 2 | 8 | 0.05% |
| 62 | Costa Rica | 0 | 0 | 0 | 0 | 0 | 0 | 1 | 4 | 1 | 1 | 7 | 0.04% |
| 63 | Philippines | 0 | 0 | 1 | 0 | 0 | 1 | 2 | 1 | 1 | 1 | 7 | 0.04% |
| 64 | Ecuador | 0 | 0 | 1 | 3 | 0 | 0 | 1 | 0 | 0 | 2 | 7 | 0.04% |
| 65 | Egypt | 0 | 0 | 0 | 1 | 0 | 2 | 1 | 0 | 0 | 3 | 7 | 0.04% |
| 66 | Kyrgyzstan | 0 | 0 | 1 | 1 | 0 | 0 | 0 | 1 | 0 | 4 | 7 | 0.04% |
| 67 | Serbia | 0 | 0 | 1 | 0 | 0 | 0 | 0 | 1 | 3 | 2 | 7 | 0.04% |
| 68 | Guatemala | 0 | 0 | 0 | 0 | 0 | 1 | 1 | 0 | 2 | 3 | 7 | 0.04% |
| 69 | Kazakhstan | 0 | 0 | 0 | 0 | 0 | 0 | 1 | 3 | 0 | 2 | 6 | 0.04% |
| 70 | Cyprus | 0 | 3 | 0 | 0 | 1 | 0 | 0 | 0 | 0 | 2 | 6 | 0.04% |
| 71 | Iceland | 0 | 1 | 0 | 1 | 0 | 1 | 0 | 2 | 0 | 0 | 5 | 0.03% |
| 72 | Lebanon | 0 | 0 | 0 | 1 | 0 | 0 | 0 | 3 | 0 | 1 | 5 | 0.03% |
| 73 | Mongolia | 0 | 0 | 0 | 0 | 2 | 0 | 0 | 0 | 0 | 3 | 5 | 0.03% |
| 74 | Morocco | 0 | 1 | 0 | 0 | 1 | 1 | 0 | 0 | 1 | 0 | 4 | 0.03% |
| 75 | Oman | 0 | 0 | 0 | 1 | 1 | 0 | 0 | 0 | 1 | 1 | 4 | 0.03% |
| 76 | Jordan | 0 | 0 | 0 | 0 | 0 | 1 | 1 | 1 | 0 | 0 | 3 | 0.02% |
| 77 | Georgia | 1 | 0 | 1 | 0 | 0 | 0 | 0 | 0 | 0 | 1 | 3 | 0.02% |
| 78 | Jamaica | 0 | 0 | 2 | 0 | 0 | 0 | 0 | 0 | 0 | 1 | 3 | 0.02% |
| 79 | Bolivia | 0 | 0 | 0 | 0 | 0 | 0 | 0 | 2 | 0 | 1 | 3 | 0.02% |
| 80 | Albania | 0 | 0 | 0 | 0 | 0 | 0 | 0 | 0 | 1 | 2 | 3 | 0.02% |
| 81 | Sri Lanka | 0 | 0 | 1 | 0 | 0 | 0 | 0 | 1 | 0 | 0 | 2 | 0.01% |
| 82 | Botswana | 0 | 0 | 0 | 0 | 0 | 1 | 1 | 0 | 0 | 0 | 2 | 0.01% |
| 83 | Moldova | 0 | 0 | 0 | 0 | 0 | 0 | 1 | 0 | 1 | 0 | 2 | 0.01% |
| 84 | Algeria | 0 | 0 | 0 | 0 | 0 | 1 | 0 | 0 | 0 | 0 | 1 | 0.01% |
| 85 | Bhutan | 0 | 1 | 0 | 0 | 0 | 0 | 0 | 0 | 0 | 0 | 1 | 0.01% |
| 86 | Cambodia | 0 | 0 | 0 | 0 | 0 | 1 | 0 | 0 | 0 | 0 | 1 | 0.01% |
| 87 | Myanmar | 0 | 0 | 1 | 0 | 0 | 0 | 0 | 0 | 0 | 0 | 1 | 0.01% |
| 88 | Nicaragua | 0 | 0 | 0 | 1 | 0 | 0 | 0 | 0 | 0 | 0 | 1 | 0.01% |
| 89 | Palestine | 1 | 0 | 0 | 0 | 0 | 0 | 0 | 0 | 0 | 0 | 1 | 0.01% |
| 90 | Panama | 0 | 0 | 1 | 0 | 0 | 0 | 0 | 0 | 0 | 0 | 1 | 0.01% |
| 91 | Saudi Arabia | 0 | 0 | 1 | 0 | 0 | 0 | 0 | 0 | 0 | 0 | 1 | 0.01% |
| 92 | Syria | 0 | 0 | 1 | 0 | 0 | 0 | 0 | 0 | 0 | 0 | 1 | 0.01% |
| 93 | Uganda | 0 | 1 | 0 | 0 | 0 | 0 | 0 | 0 | 0 | 0 | 1 | 0.01% |
| 94 | Zimbabwe | 0 | 0 | 0 | 0 | 0 | 1 | 0 | 0 | 0 | 0 | 1 | 0.01% |
| 95 | Yemen | 0 | 0 | 0 | 0 | 0 | 0 | 1 | 0 | 0 | 0 | 1 | 0.01% |
| 96 | Tunisia | 0 | 0 | 0 | 0 | 0 | 0 | 0 | 0 | 1 | 0 | 1 | 0.01% |
| 97 | Hong Kong | 0 | 0 | 0 | 0 | 0 | 0 | 0 | 0 | 0 | 1 | 1 | 0.01% |
| 98 | Montenegro | 0 | 0 | 0 | 0 | 0 | 0 | 0 | 0 | 0 | 1 | 1 | 0.01% |
| 99 | UAE | 0 | 0 | 0 | 0 | 0 | 0 | 0 | 0 | 0 | 1 | 1 | 0.01% |
| 1122 | 1243 | 1423 | 1411 | 1424 | 1340 | 1568 | 1963 | 2068 | 2201 | 15763 | 100.00% |
How old are the students on Tushita’s courses?
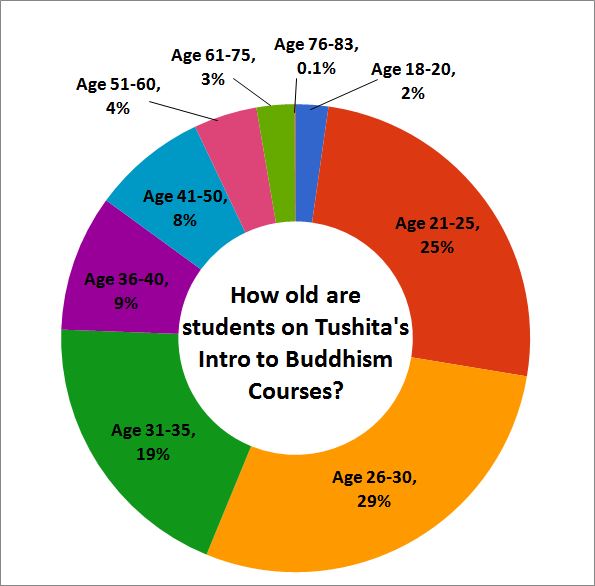
As you can see from the graph below, more than half of our Introduction to Buddhism course students are in their 20’s. What’s interesting to note is that our student demographic has slightly matured this year. The ring chart below shows that 56% of students were aged 18 – 30 (compared to 59% last year), 28% aged 31 – 40 (up 1%), and 15% were over 40 (also up 1%).
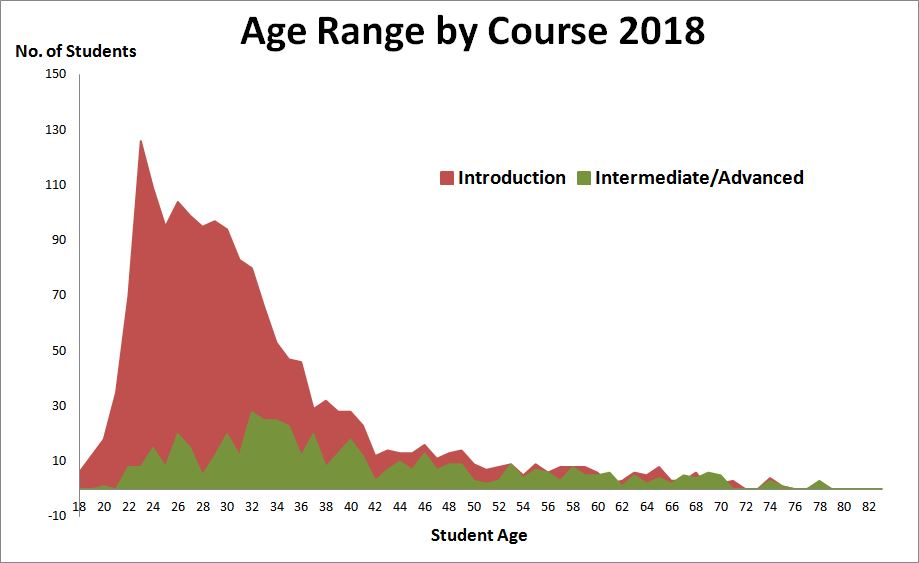
While the majority of students in Introductory courses are under 30, in our Intermediate courses there is a much more even spread of ages. We don’t have the same predominance of students in their twenties in our Intermediate courses that we do in our Introductory courses; instead Intermediate course students are primarily in their thirties. This is evidenced in the graph below showing the age range of Intermediate course students (green) against that of the Introductory course students (red).
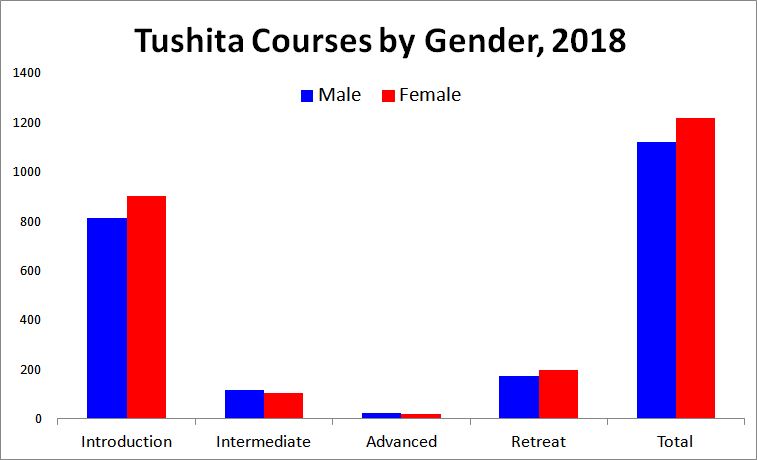
How many Men & Women take part in our courses (2018)?
Over the 10 years we’ve been studying our records, the gender balance of students has remained surprisingly stable, with always 5-10% more women than men taking part. The exact same ration of men to women have participated in our courses this year compared to last year.
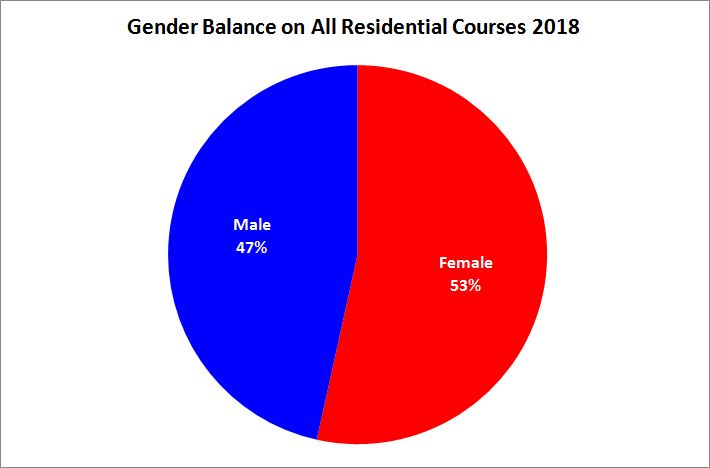
The graph below depicts the breakdown of gender by course types in 2018. Usually we have slightly more females than males in all of our courses, but this year we actually had slightly more males than females in both our Intermediate and Advanced courses.