
Tushita’s Annual Statistics Report 2009 – 2019
December 2019
Many changes have occurred in the last decade around the world, and certainly here at Tushita. 2009 marked the first year that we began collecting data, enabling us to look back and make a comparison of changes of the period from 2009 to 2019!
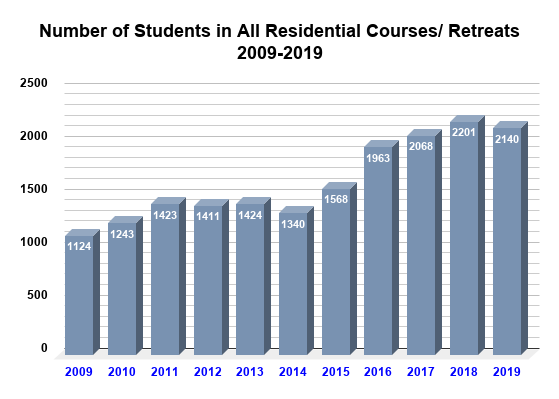
During this time, not only have we increased the number of residential courses and group retreats, we have nearly doubled the number of residential students that we serve per year! The nationalities of these students grew in this time period from 55 to an incredible 103, and to our great delight, our host country India moved to the number one place. (See Figure 1)
Thousands more have attended our non-residential short courses and our drop-in activities, such as our very popular daily Guided Morning Meditations which commenced in 2010, Video Days, regular Pujas and Sutra Readings. In addition, we were amazingly fortunate to be able to host many special guest teachers for courses, teachings, initiations and other special events every year. Please have a look at our December 2019 Newsletter for some truly inspirational reading.
All these activities make Tushita a very special place. Please join us in looking back and rejoicing in how far we have come!
Looking back: Since 2009 we have been offering 3 different Dharma activities at the same time!
In 2008 we completed the rebuilding of our Main Gompa and as a result we now have 3 meditation halls. With so many students coming to Tushita, we fill them easily! If we had more space and resources, we would love to do even more…
Introduction to Buddhism Courses (10 Day Residential)
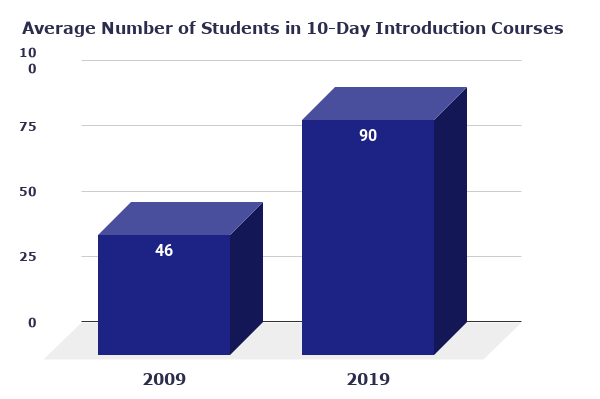
For many decades introducing new students to the Dharma was our main purpose and our very popular Introduction to Buddhism courses used to be the core of our program. With long waiting lists all year around, they still attract the greatest number of students (we had the highest average of 99.4 students per course in 2018 and in 2019 it was 90). You can see the impressive growth of the Introduction to Buddhism Courses from 2009 to 2019 in Figure 2 below.
Intermediate / Advanced Courses (9 to 14 Day Residential)
After doing an introductory course, many students would like to deepen their studies and practice. In 2009, in order to fulfill this growing demand, we began to offer intermediate and advanced courses on a regular basis. They have been hugely successful, with students repeatedly returning and courses often booked out many months in advance.
Group Retreats (9 to 99 Day Residential)
Tushita was founded in 1972 as a retreat centre and although we have evolved over the years into quite a busy teaching centre, we haven’t forgotten our roots. We continue to offer regular annual group retreats.
Experienced meditators also have the opportunity to use our personal retreat facilities. In mid 2015 we finished rebuilding our 3 retreat huts in the forest, which enables us to offer beautiful and comfortable retreat space in a very blessed and conducive environment.
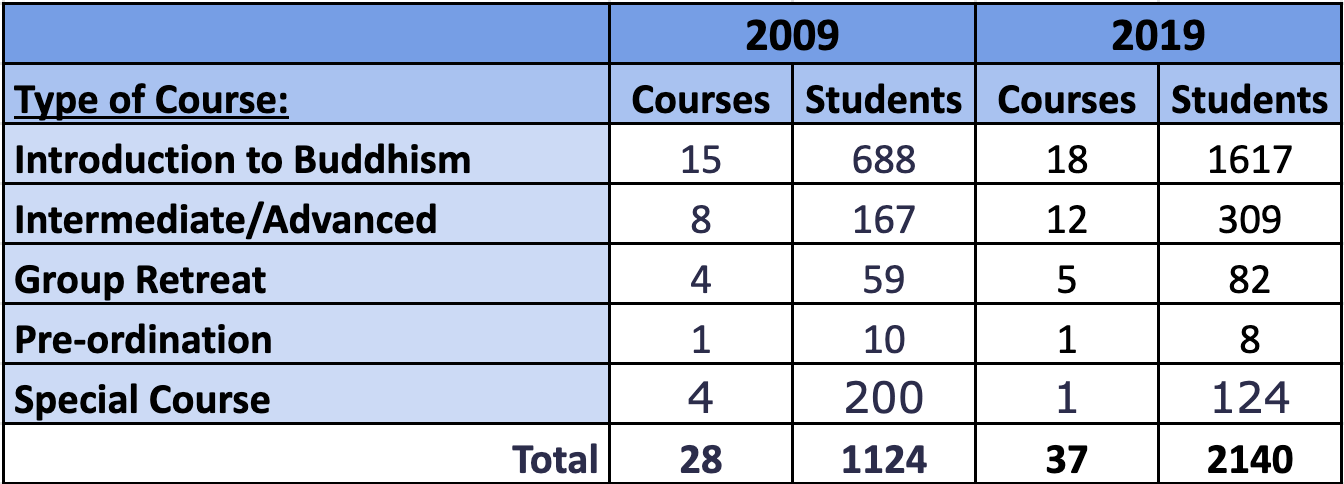
Table A above displays the number of different types of courses/retreats with the number of students in attendance in 2009 and 2019. Compared to 2009, we now offer an extra nine residential courses/retreats annually. We are also hosting over 1,000 more people at Tushita. That is a 90% increase! This was possible due access to an increased number of qualified and dedicated teachers, together with a growing demand for courses/retreats.
Even with the increase in the number of courses/retreats and larger course sizes, we still have long waiting lists! Due to the lack of accommodation, we are often faced with the unfortunate situation of having to turn away eager people. It has been our dream for a long time to build extra and more comfortable accommodation. Presently, we are fundraising to build a new accommodation block.
Short Non-Residential Courses and Drop-In Activities (daily guided meditations, video days, pujas etc.)
For those unable to commit to one of our many residential courses/retreats, we offer shorter non-residential courses. These were as popular in 2009 as they are now. In 2019, we offered 7 short courses, which attracted a total of 552 participants! With such a positive response, we are encouraged to host more next year.
In 2010, we successfully offered daily guided meditations all year around. In fact, they are so popular, we often have to squeeze more than 100 people into our gompa. Over the past 11 years, our drop-in sessions have totaled a breathtakingly auspicious 121,592 “cushion units”! This number includes people who often attend these sessions frequently.
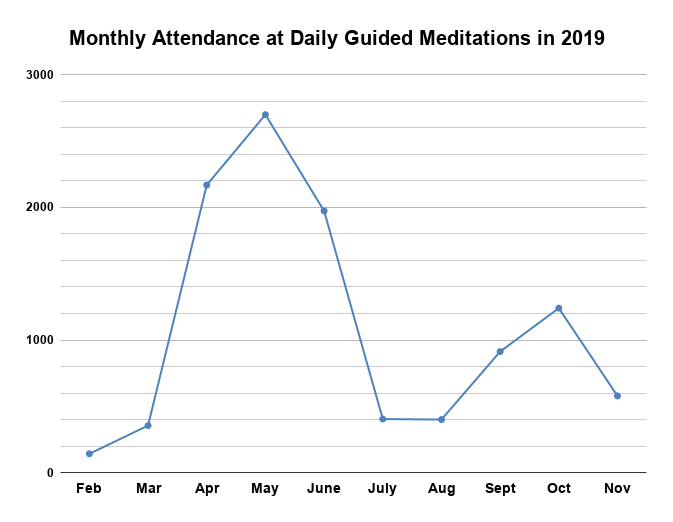
Throughout 2019, these drop in sessions have proved very popular with visitors. In Figure 3 above you may be wondering… why is there a dramatic drop in numbers of attendees from July through to September? During this period we hosted a 3-month group retreat together with two residential courses and had to suspend the morning meditations. Our very conservative estimate of total attendance for 2019 is 10,905 with a total of 200 people attending the meditation on May 30th. Looking forward, it appears we need to build a 4th Gompa!!
But who are these people who come on Tushita courses?
Who are our Indian Students?
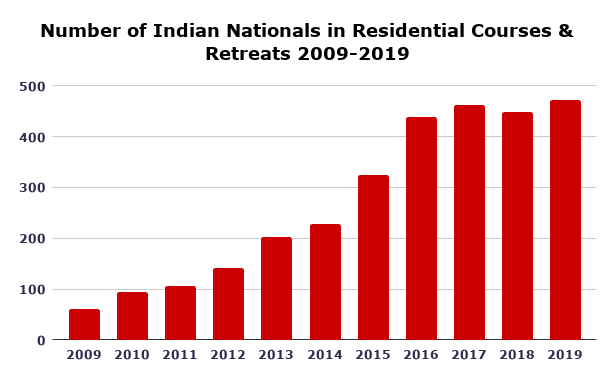
We are so happy to welcome so many Indian students to our courses and retreats. During the period of 2009 to 2019 the interest by Indian in Buddhism has increased tremendously. The graph below (Figure 1) demonstrates this steady growth.
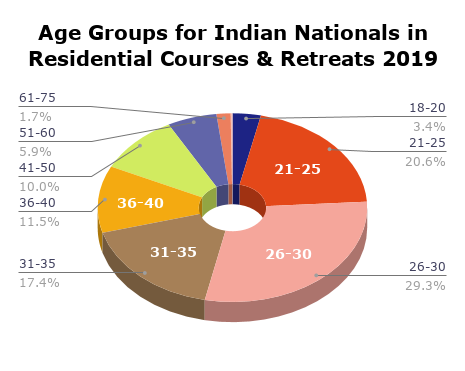
Traditionally in India the later stages of life (after one’s children are grown) are when one prioritizes spiritual practices and development. Thus it is fascinating to see in the figure below that 67.3% of our Indian students are between the ages of 21 and 35. This shift of interest to younger generations is remarkable given the traditional context and one which we celebrate. The sooner we begin to understand the nature of our mind and reality, the sooner we can bring greater peace and happiness into our lives and those around us! See Figure 2 below .
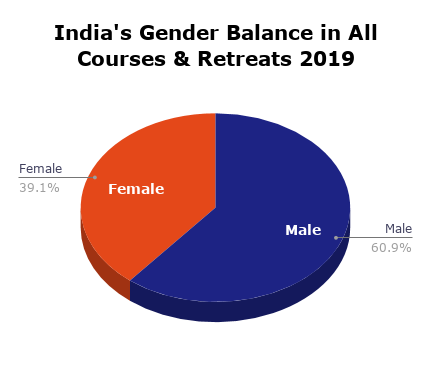
As the pie chart (Figure 3) below reveals, less than 2/3 of our Indian students are male. Women gained a little more ground this year compared to last: a 3% increase.
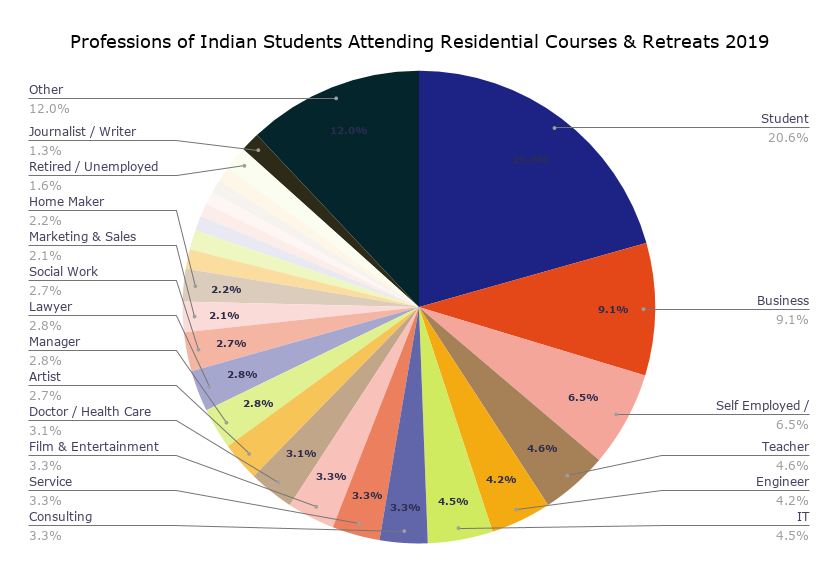
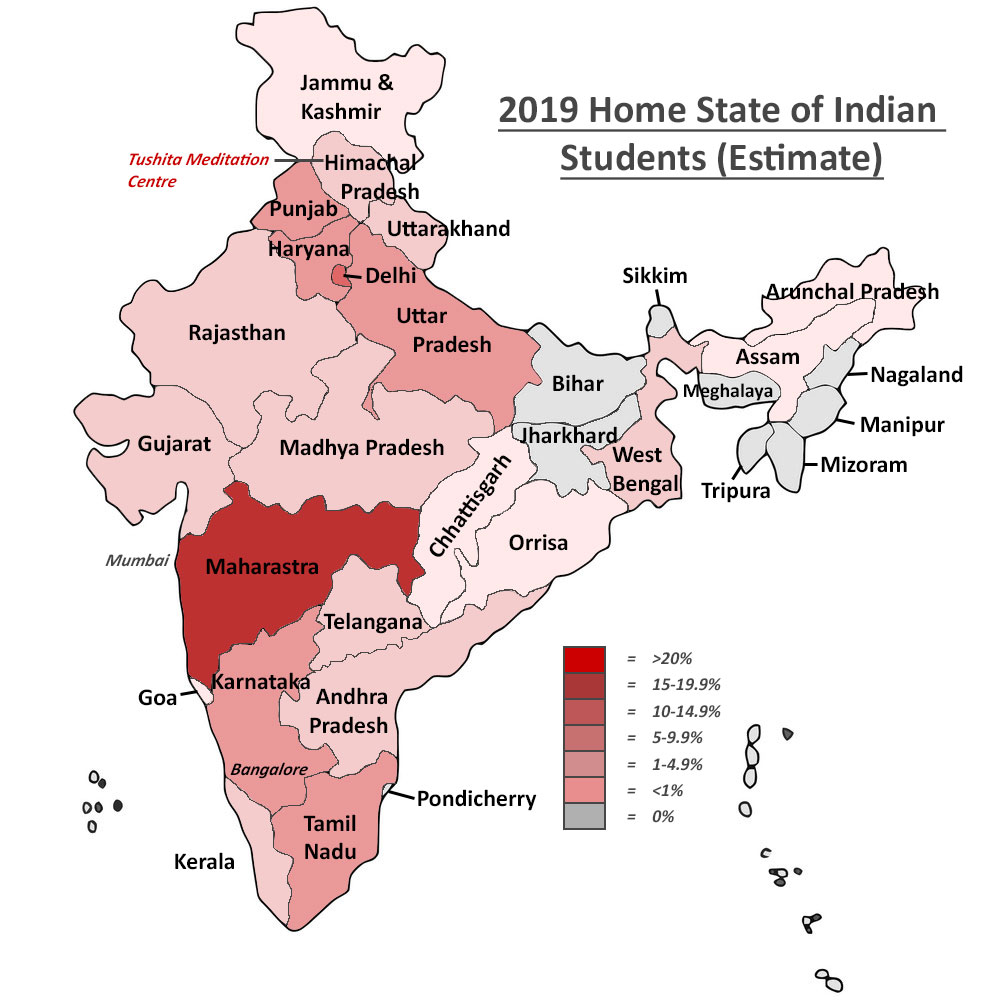
In celebration of the great increase of Indian students at Tushita, we have decided to take a closer look into who is coming! This year we began looking into two new areas of interest for our statistics; the professions of Indian students attending residential courses/retreats and which state of India they are coming from.
You can see that the largest percentage (almost 21%) of Indian participants are students, 9.1% work in business, 6.5% are self employed, 4.6% are teachers, 4.5% are engineers, another 4.5% work in IT and another 12% in other professions. We have also found that a large percentage came from the state of Maharashtra, as well as neighboring states to Himachal Pradesh and some southern states. (Figure 4 & 5)
Where are Tushita’s Students from?
In 2009, we had students from 55 different countries attending our residential courses/retreats and in 2019 we had students from 103 countries! This year we were happy to welcome students for the first time from Kuwait, Laos, Kenya and Bosnia-Herzegovina!
At the bottom of the page, you can view the full list of 103 countries. See if your country is represented. If not: come take a course at Tushita, we need you to help us reach our next goal of 108!
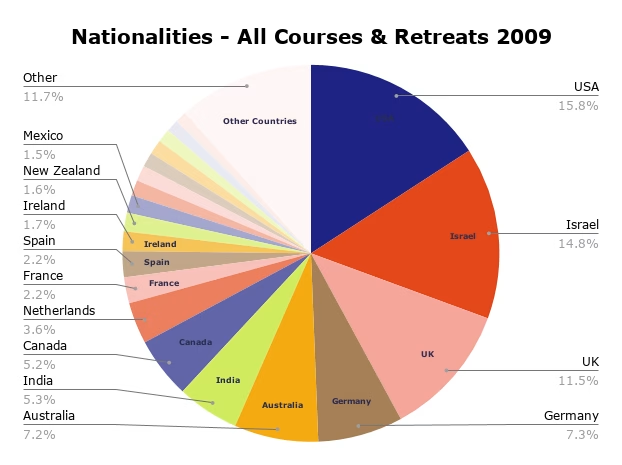
In Table A & B you can see a list of the top ten nationalities represented in our residential courses/retreats from 2009 and now in 2019.
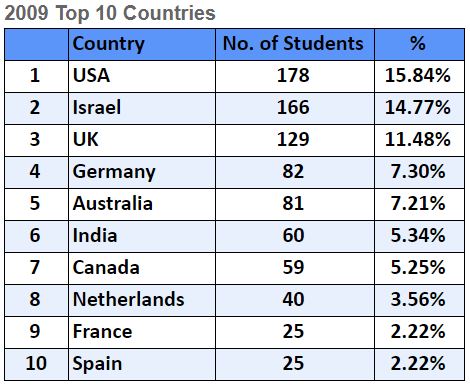
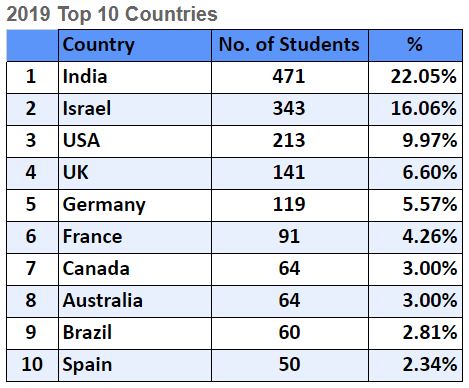
As you can see, we have seen the biggest increase from India. In 2009 our host country ranked at #6 with only 60 students, and about 5% of the total. This year India is sitting comfortably at #1! There were 471 people from India this year, which is 22% of our total number of students. We are very happy to see that Tushita’s courses and retreats have gained popularity within our beloved host country – after all India is where Buddhism started.
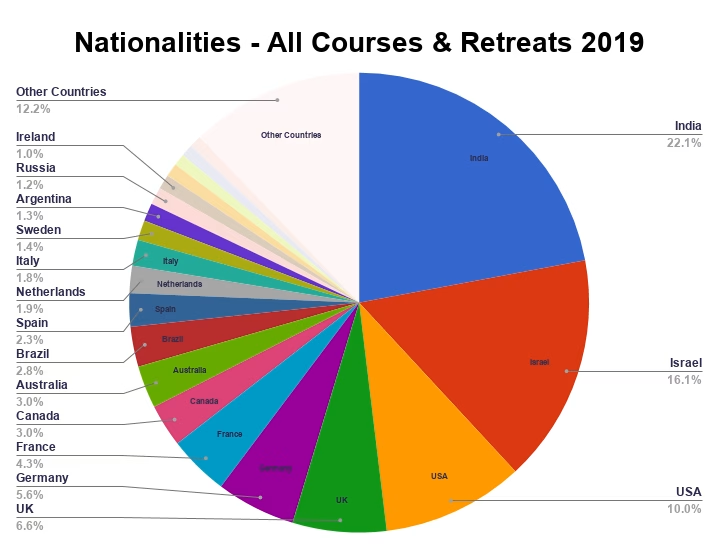
In the pie charts below (Figure 1 & 2), students from India have surpassed USA, Israel, UK, Germany and Australia as the most common nationality on all courses and retreats in 2019, while Israel still consistently ranks in second place.
The drop of students from the USA – from being the number one country in 2009 to number 3 in 2019, can be partly explained by the drop of American Student Groups, whose organizers make a Tushita course an integral part of their annual itinerary.
Interesting is also the rise of Brazil into the top then countries, signifying the increased interest in Buddhism in South America.
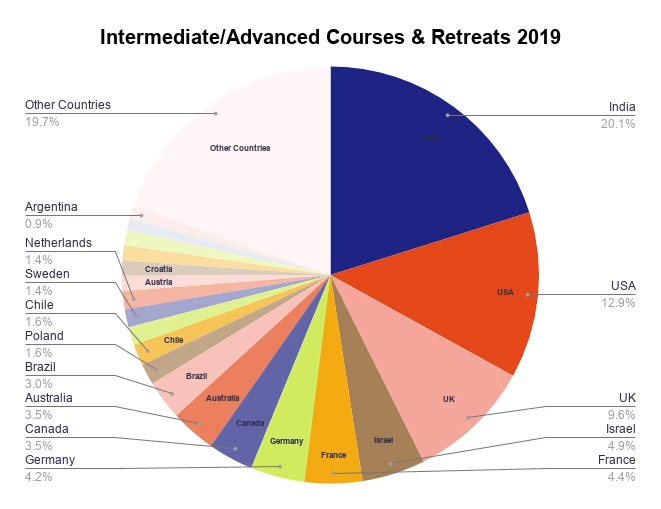
India is also by far the most represented nationality in intermediate/ advanced courses and group retreats, with many Indians returning to Tushita repeatedly to refresh and deepen their studies and practice. (As seen in figures 3 and 4).
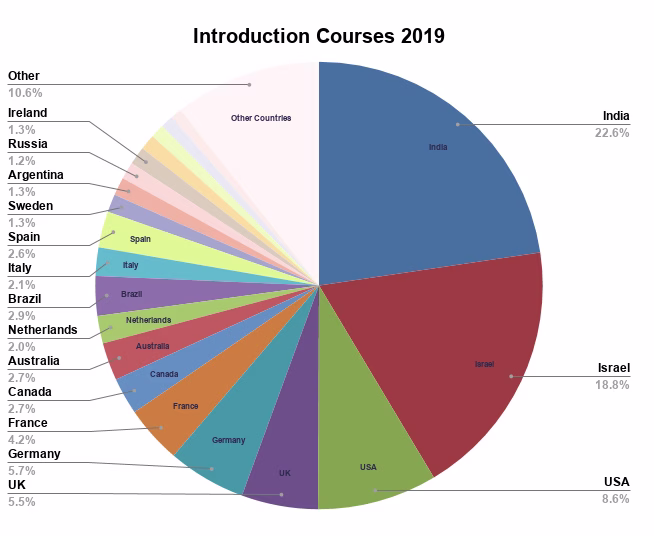
On the other hand Israel, who has been consistently over the years our second most represented country for introductory courses, ranks only number 4 for intermediate/ advanced courses and group retreats.
This pattern we saw already in 2009 and our first stats report back then explained the following:
In relation to Israel being our second most represented country: it is very common for young Israelis to travel to India after they have finished their National Service in the Army. The trend is for them to travel in India for periods of several months, at a time when they are in a period of transition and reflection in their lives. These young Israeli citizens are often therefore seeking insight from alternative sources of wisdom, while not actually intending to adopt any fundamental changes in their own religious practices, belief or non-belief. So while many students who attend our Introductory courses go on to take an Intermediate Level course, the difference between our top 3 countries in “Introduction to Buddhism” courses (USA, Israel and the United Kingdom) and in Intermediate Level courses can be explained by there being a large number of travellers who only ever intend to explore introductory Buddhism, in order to gain some techniques and philosophical ideas which may enhance their established lifestyles.
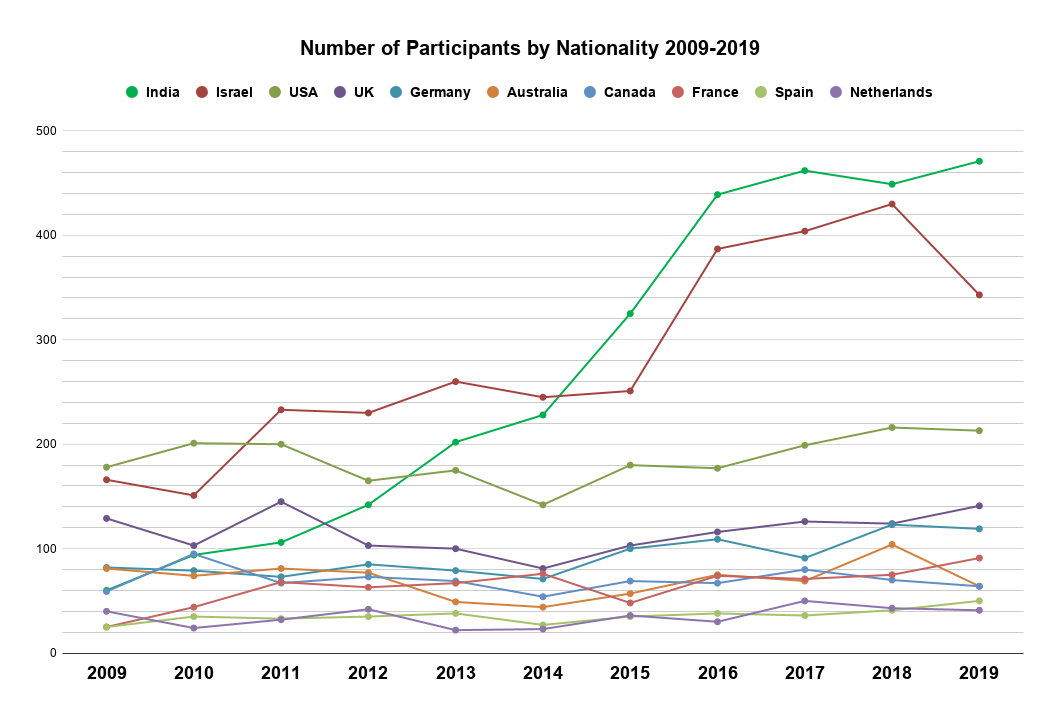
As you can see in the graph below (Figure 5), India jumped ahead of Israel in 2015 to become the most common nationality in all courses/retreats and continues to increase today. Even though India is surpassing all the other countries each year, Israel is still the most represented country throughout the years that we have been measuring, with a grand total of 3,100 students compared to 2,978 students from India. Stay tuned in 2020 to see if India will take the lead in the grand total.
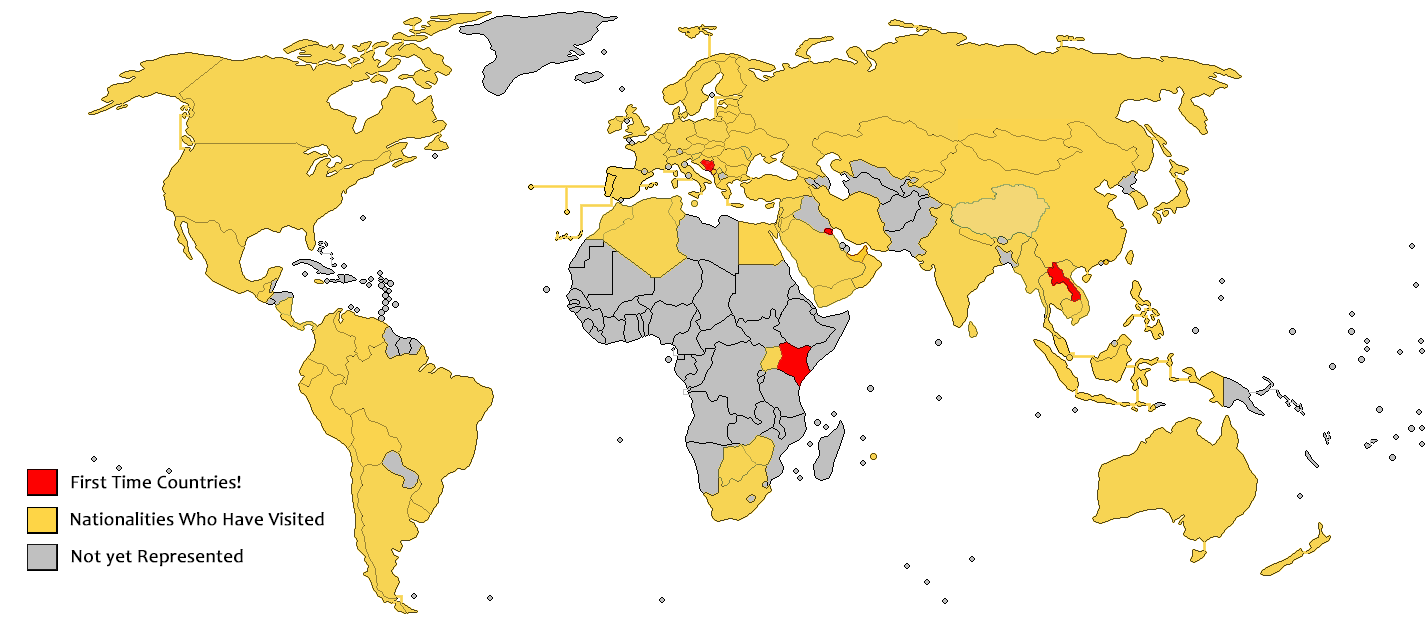
The world map below (Figure 6) shows where all of our students have come from for the first time this year, in the past, and the countries that still haven’t taken part in Tushita’s courses & retreats. If your country is in Grey, please come for a course and/or retreat! We would be so happy to welcome you, Africa!
Unpack to view all 103 countries that have participated in Residential Courses 2009-19
| # | Native Country of Residential Students | 2009 | 2010 | 2011 | 2012 | 2013 | 2014 | 2015 | 2016 | 2017 | 2018 | 2019 | 2009 – 2019 | % From 2009 – 2019 |
| 1 | Israel | 166 | 151 | 233 | 230 | 260 | 245 | 251 | 387 | 404 | 430 | 343 | 3100 | 17.33% |
| 2 | India | 60 | 94 | 106 | 142 | 202 | 228 | 325 | 439 | 462 | 449 | 471 | 2978 | 16.65% |
| 3 | USA | 178 | 201 | 200 | 165 | 175 | 142 | 180 | 177 | 199 | 216 | 213 | 2046 | 11.44% |
| 4 | UK | 129 | 103 | 145 | 103 | 100 | 81 | 103 | 116 | 126 | 124 | 141 | 1271 | 7.10% |
| 5 | Germany | 82 | 79 | 73 | 85 | 79 | 71 | 100 | 109 | 91 | 123 | 119 | 1011 | 5.65% |
| 6 | Australia | 81 | 74 | 81 | 77 | 49 | 44 | 57 | 75 | 69 | 104 | 64 | 775 | 4.33% |
| 7 | Canada | 59 | 95 | 67 | 73 | 69 | 54 | 69 | 67 | 80 | 70 | 64 | 767 | 4.29% |
| 8 | France | 25 | 44 | 68 | 63 | 67 | 76 | 48 | 74 | 71 | 75 | 91 | 702 | 3.92% |
| 9 | Spain | 25 | 35 | 33 | 35 | 38 | 27 | 35 | 38 | 36 | 41 | 50 | 393 | 2.20% |
| 10 | Netherlands | 40 | 24 | 32 | 42 | 22 | 23 | 36 | 30 | 50 | 43 | 41 | 383 | 2.14% |
| 11 | Brazil | 10 | 18 | 15 | 25 | 15 | 26 | 24 | 33 | 40 | 39 | 60 | 305 | 1.70% |
| 12 | Sweden | 13 | 25 | 26 | 35 | 34 | 18 | 16 | 29 | 29 | 17 | 30 | 272 | 1.52% |
| 13 | Italy | 14 | 16 | 14 | 17 | 22 | 13 | 23 | 32 | 35 | 35 | 39 | 260 | 1.45% |
| 14 | Austria | 12 | 18 | 27 | 31 | 16 | 10 | 25 | 19 | 29 | 21 | 18 | 226 | 1.26% |
| 15 | Argentina | 7 | 8 | 14 | 17 | 14 | 19 | 20 | 25 | 23 | 41 | 27 | 215 | 1.20% |
| 16 | Russia | 8 | 2 | 7 | 9 | 26 | 26 | 26 | 27 | 20 | 31 | 26 | 208 | 1.16% |
| 17 | Mexico | 17 | 21 | 19 | 24 | 14 | 10 | 9 | 23 | 21 | 30 | 14 | 202 | 1.13% |
| 18 | Switzerland | 15 | 26 | 14 | 28 | 15 | 15 | 8 | 13 | 21 | 29 | 15 | 199 | 1.11% |
| 19 | Ireland | 19 | 16 | 22 | 16 | 14 | 15 | 10 | 20 | 19 | 17 | 22 | 190 | 1.06% |
| 20 | New Zealand | 18 | 20 | 12 | 6 | 11 | 8 | 11 | 16 | 19 | 23 | 18 | 162 | 0.91% |
| 21 | Belgium | 11 | 9 | 9 | 17 | 9 | 16 | 18 | 13 | 16 | 14 | 13 | 145 | 0.81% |
| 22 | Poland | 6 | 9 | 9 | 9 | 10 | 19 | 11 | 18 | 15 | 16 | 17 | 139 | 0.78% |
| 23 | Chile | 1 | 10 | 12 | 3 | 12 | 8 | 13 | 21 | 21 | 15 | 18 | 134 | 0.75% |
| 24 | Denmark | 15 | 10 | 16 | 13 | 10 | 8 | 7 | 6 | 14 | 12 | 10 | 121 | 0.68% |
| 25 | Colombia | 2 | 8 | 7 | 7 | 7 | 13 | 13 | 13 | 13 | 19 | 16 | 118 | 0.66% |
| 26 | Finland | 14 | 6 | 18 | 9 | 11 | 6 | 9 | 14 | 10 | 3 | 6 | 106 | 0.59% |
| 27 | Portugal | 6 | 1 | 15 | 9 | 15 | 3 | 6 | 11 | 13 | 7 | 20 | 106 | 0.59% |
| 28 | South Africa | 9 | 4 | 5 | 7 | 12 | 9 | 14 | 14 | 9 | 12 | 7 | 102 | 0.57% |
| 29 | South Korea | 9 | 7 | 12 | 20 | 12 | 6 | 3 | 9 | 6 | 10 | 4 | 98 | 0.55% |
| 30 | Japan | 11 | 6 | 11 | 8 | 11 | 4 | 5 | 4 | 6 | 12 | 6 | 84 | 0.47% |
| 31 | Turkey | 3 | 6 | 5 | 5 | 2 | 6 | 5 | 6 | 14 | 7 | 13 | 72 | 0.40% |
| 32 | Singapore | 2 | 10 | 7 | 7 | 1 | 1 | 7 | 1 | 6 | 10 | 6 | 58 | 0.32% |
| 33 | Czech Republic | 4 | 2 | 7 | 6 | 5 | 7 | 3 | 3 | 7 | 7 | 0 | 51 | 0.29% |
| 34 | Ukraine | 2 | 5 | 3 | 3 | 6 | 7 | 2 | 6 | 2 | 3 | 10 | 49 | 0.27% |
| 35 | Taiwan | 4 | 16 | 1 | 3 | 7 | 3 | 6 | 0 | 1 | 1 | 8 | 49 | 0.27% |
| 36 | Slovenia | 5 | 1 | 2 | 8 | 4 | 9 | 9 | 3 | 0 | 0 | 5 | 47 | 0.26% |
| 37 | Romania | 1 | 3 | 2 | 2 | 5 | 6 | 5 | 5 | 9 | 2 | 5 | 45 | 0.25% |
| 38 | China | 1 | 2 | 3 | 4 | 5 | 4 | 4 | 1 | 4 | 8 | 7 | 43 | 0.24% |
| 39 | Norway | 2 | 5 | 2 | 8 | 6 | 2 | 3 | 5 | 5 | 3 | 1 | 42 | 0.23% |
| 40 | Slovakia | 3 | 7 | 5 | 0 | 0 | 5 | 3 | 3 | 1 | 6 | 7 | 40 | 0.22% |
| 41 | Hungary | 2 | 6 | 2 | 3 | 4 | 6 | 3 | 3 | 2 | 2 | 4 | 37 | 0.21% |
| 42 | Thailand | 0 | 1 | 5 | 0 | 2 | 2 | 6 | 1 | 1 | 11 | 4 | 33 | 0.18% |
| 43 | Estonia | 5 | 1 | 10 | 2 | 1 | 1 | 2 | 4 | 1 | 1 | 2 | 30 | 0.17% |
| 44 | Vietnam | 6 | 0 | 1 | 3 | 3 | 3 | 0 | 3 | 8 | 0 | 3 | 30 | 0.17% |
| 45 | Tibet | 3 | 5 | 4 | 0 | 6 | 1 | 2 | 1 | 3 | 0 | 4 | 29 | 0.16% |
| 46 | Malaysia | 1 | 8 | 1 | 4 | 0 | 1 | 3 | 3 | 0 | 3 | 4 | 28 | 0.16% |
| 47 | Bulgaria | 0 | 0 | 2 | 0 | 3 | 2 | 3 | 5 | 4 | 3 | 6 | 28 | 0.16% |
| 48 | Greece | 5 | 4 | 1 | 3 | 1 | 5 | 3 | 2 | 0 | 1 | 7 | 28 | 0.16% |
| 49 | Lithuania | 1 | 0 | 2 | 5 | 0 | 2 | 4 | 3 | 2 | 2 | 2 | 27 | 0.15% |
| 50 | Indonesia | 0 | 5 | 10 | 0 | 0 | 1 | 1 | 0 | 1 | 3 | 0 | 21 | 0.12% |
| 51 | Mauritius | 0 | 2 | 1 | 1 | 1 | 3 | 1 | 2 | 4 | 1 | 3 | 19 | 0.11% |
| 52 | Latvia | 1 | 1 | 5 | 2 | 1 | 1 | 0 | 2 | 2 | 1 | 0 | 16 | 0.09% |
| 53 | Croatia | 0 | 0 | 0 | 0 | 0 | 0 | 1 | 5 | 2 | 1 | 6 | 15 | 0.08% |
| 54 | Peru | 0 | 2 | 0 | 1 | 0 | 1 | 1 | 0 | 4 | 2 | 4 | 15 | 0.08% |
| 55 | Iran | 0 | 1 | 3 | 0 | 0 | 0 | 2 | 3 | 1 | 3 | 0 | 13 | 0.07% |
| 56 | Luxembourg | 4 | 0 | 1 | 2 | 0 | 0 | 0 | 0 | 0 | 3 | 0 | 10 | 0.06% |
| 57 | Venezuela | 1 | 1 | 1 | 1 | 0 | 3 | 0 | 0 | 1 | 1 | 1 | 10 | 0.06% |
| 58 | Belarus | 0 | 0 | 1 | 1 | 2 | 1 | 2 | 0 | 0 | 2 | 0 | 9 | 0.05% |
| 59 | Malta | 1 | 0 | 2 | 1 | 1 | 2 | 1 | 0 | 1 | 0 | 0 | 9 | 0.05% |
| 60 | Uruguay | 0 | 1 | 0 | 0 | 1 | 1 | 0 | 2 | 2 | 1 | 1 | 9 | 0.05% |
| 61 | Nepal | 1 | 1 | 0 | 2 | 1 | 0 | 0 | 0 | 1 | 2 | 1 | 9 | 0.05% |
| 62 | Ecuador | 0 | 0 | 1 | 3 | 0 | 0 | 1 | 0 | 0 | 2 | 2 | 9 | 0.05% |
| 63 | Philippines | 0 | 0 | 1 | 0 | 0 | 1 | 2 | 1 | 1 | 1 | 1 | 8 | 0.04% |
| 64 | Egypt | 0 | 0 | 0 | 1 | 0 | 2 | 1 | 0 | 0 | 3 | 1 | 8 | 0.04% |
| 65 | Kyrgyzstan | 0 | 0 | 1 | 1 | 0 | 0 | 0 | 1 | 0 | 4 | 1 | 8 | 0.04% |
| 66 | Serbia | 0 | 0 | 1 | 0 | 0 | 0 | 0 | 1 | 3 | 2 | 1 | 8 | 0.04% |
| 67 | Mongolia | 0 | 0 | 0 | 0 | 2 | 0 | 0 | 0 | 0 | 3 | 3 | 8 | 0.04% |
| 68 | Costa Rica | 0 | 0 | 0 | 0 | 0 | 0 | 1 | 4 | 1 | 1 | 0 | 7 | 0.04% |
| 69 | Guatemala | 0 | 0 | 0 | 0 | 0 | 1 | 1 | 0 | 2 | 3 | 0 | 7 | 0.04% |
| 70 | Morocco | 0 | 1 | 0 | 0 | 1 | 1 | 0 | 0 | 1 | 0 | 3 | 7 | 0.04% |
| 71 | Cyprus | 0 | 3 | 0 | 0 | 1 | 0 | 0 | 0 | 0 | 2 | 0 | 6 | 0.03% |
| 72 | Bolivia | 0 | 0 | 0 | 0 | 0 | 0 | 0 | 2 | 0 | 1 | 3 | 6 | 0.03% |
| 73 | Lebanon | 0 | 0 | 0 | 1 | 0 | 0 | 0 | 3 | 0 | 1 | 1 | 6 | 0.03% |
| 74 | Kazakhstan | 0 | 0 | 0 | 0 | 0 | 0 | 1 | 3 | 0 | 2 | 0 | 6 | 0.03% |
| 75 | Iceland | 0 | 1 | 0 | 1 | 0 | 1 | 0 | 2 | 0 | 0 | 0 | 5 | 0.03% |
| 76 | Oman | 0 | 0 | 0 | 1 | 1 | 0 | 0 | 0 | 1 | 1 | 1 | 5 | 0.03% |
| 77 | Hong Kong | 0 | 0 | 0 | 0 | 0 | 0 | 0 | 0 | 0 | 1 | 4 | 5 | 0.03% |
| 78 | Albania | 0 | 0 | 0 | 0 | 0 | 0 | 0 | 0 | 1 | 2 | 1 | 4 | 0.02% |
| 79 | Moldova | 0 | 0 | 0 | 0 | 0 | 0 | 1 | 0 | 1 | 0 | 2 | 4 | 0.02% |
| 80 | Georgia | 1 | 0 | 1 | 0 | 0 | 0 | 0 | 0 | 0 | 1 | 0 | 3 | 0.02% |
| 81 | Jamaica | 0 | 0 | 2 | 0 | 0 | 0 | 0 | 0 | 0 | 1 | 0 | 3 | 0.02% |
| 82 | Jordan | 0 | 0 | 0 | 0 | 0 | 1 | 1 | 1 | 0 | 0 | 0 | 3 | 0.02% |
| 83 | Sri Lanka | 0 | 0 | 1 | 0 | 0 | 0 | 0 | 1 | 0 | 0 | 0 | 2 | 0.01% |
| 84 | Botswana | 0 | 0 | 0 | 0 | 0 | 1 | 1 | 0 | 0 | 0 | 0 | 2 | 0.01% |
| 85 | Saudi Arabia | 0 | 0 | 1 | 0 | 0 | 0 | 0 | 0 | 0 | 0 | 1 | 2 | 0.01% |
| 86 | Bhutan | 0 | 1 | 0 | 0 | 0 | 0 | 0 | 0 | 0 | 0 | 1 | 2 | 0.01% |
| 87 | Cambodia | 0 | 0 | 0 | 0 | 0 | 1 | 0 | 0 | 0 | 0 | 1 | 2 | 0.01% |
| 88 | Myanmar | 0 | 0 | 1 | 0 | 0 | 0 | 0 | 0 | 0 | 0 | 0 | 1 | 0.01% |
| 89 | Nicaragua | 0 | 0 | 0 | 1 | 0 | 0 | 0 | 0 | 0 | 0 | 0 | 1 | 0.01% |
| 90 | Palestine | 1 | 0 | 0 | 0 | 0 | 0 | 0 | 0 | 0 | 0 | 0 | 1 | 0.01% |
| 91 | Panama | 0 | 0 | 1 | 0 | 0 | 0 | 0 | 0 | 0 | 0 | 0 | 1 | 0.01% |
| 92 | Algeria | 0 | 0 | 0 | 0 | 0 | 1 | 0 | 0 | 0 | 0 | 0 | 1 | 0.01% |
| 93 | Syria | 0 | 0 | 1 | 0 | 0 | 0 | 0 | 0 | 0 | 0 | 0 | 1 | 0.01% |
| 94 | Uganda | 0 | 1 | 0 | 0 | 0 | 0 | 0 | 0 | 0 | 0 | 0 | 1 | 0.01% |
| 95 | Zimbabwe | 0 | 0 | 0 | 0 | 0 | 1 | 0 | 0 | 0 | 0 | 0 | 1 | 0.01% |
| 96 | Yemen | 0 | 0 | 0 | 0 | 0 | 0 | 1 | 0 | 0 | 0 | 0 | 1 | 0.01% |
| 97 | Tunisia | 0 | 0 | 0 | 0 | 0 | 0 | 0 | 0 | 1 | 0 | 0 | 1 | 0.01% |
| 98 | Montenegro | 0 | 0 | 0 | 0 | 0 | 0 | 0 | 0 | 0 | 1 | 0 | 1 | 0.01% |
| 99 | UAE | 0 | 0 | 0 | 0 | 0 | 0 | 0 | 0 | 0 | 1 | 0 | 1 | 0.01% |
| 100 | Kuwait | 0 | 0 | 0 | 0 | 0 | 0 | 0 | 0 | 0 | 0 | 1 | 1 | 0.01% |
| 101 | Laos | 0 | 0 | 0 | 0 | 0 | 0 | 0 | 0 | 0 | 0 | 1 | 1 | 0.01% |
| 102 | Kenya | 0 | 0 | 0 | 0 | 0 | 0 | 0 | 0 | 0 | 0 | 1 | 1 | 0.01% |
| 103 | Bosnia & Herzegovina | 0 | 0 | 0 | 0 | 0 | 0 | 0 | 0 | 0 | 0 | 1 | 1 | 0.01% |
| 1122 | 1243 | 1423 | 1411 | 1424 | 1340 | 1568 | 1963 | 2068 | 2201 | 2128 | 17891 | 100.00% |
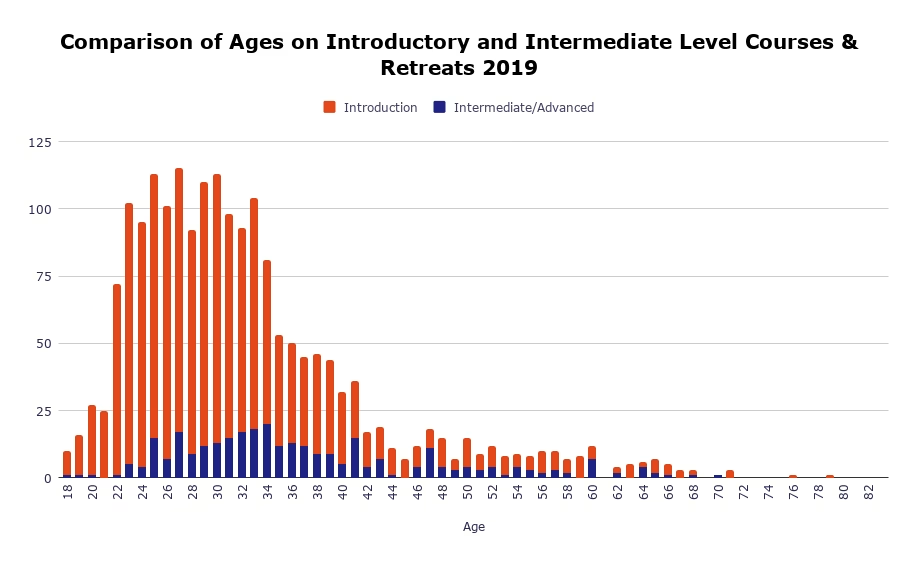
How old are the students on Tushita’s courses then and now?
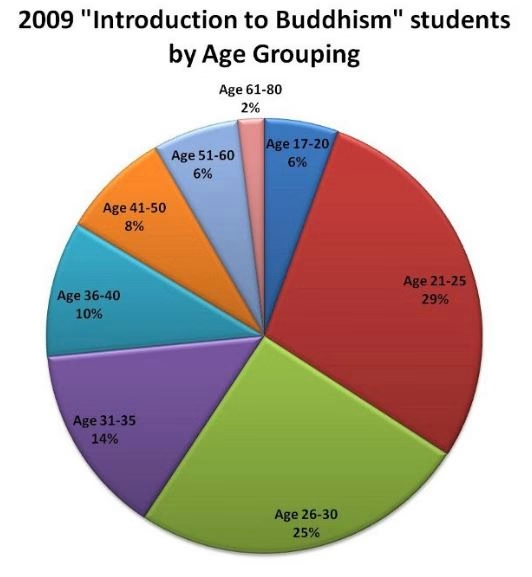
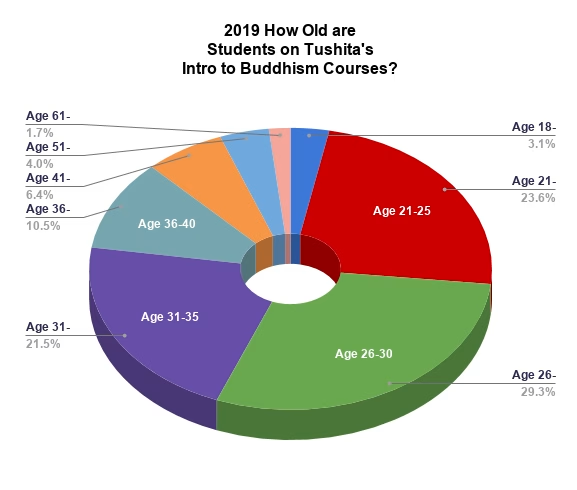
Looking at our ” Introduction to Buddhism” students in 2009 and 2019 (Figure 1 & 2) , the clear majority of our students are still young adults in the age group of 17-30 (60% in 2009, 56% in 2019), although there has been a decrease of students under 25 from 35% to 26.7% and especially under 18.
This shift of students getting slightly older, one can also see in the 8% increase of students in their early thirties.
Trying to find an explanation for this shift we came up with the following.
As mentioned in our nationality section, over the years we had a drop in numbers from American Youth Groups and with that students under 20 and especially age 17. To be accepted in any of our residential courses students usually have to be at least the legal age of 18 years old.
Another factor might be the rise of Indian students, which are now our biggest country group. So we looked at their age chart and discovered that the percentages of students under 30 are almost identical with the international 2019 chart. Showing also that the biggest group of Indian students with 29.3% are 26 – 30 years old.
While most of the students in Introductory courses are between the ages of 22 and 35, in our Intermediate courses there is a more even spread of ages. The Intermediate course students are primarily between 25 and 41, with many people in their 50’s and 60’s. This is evident in the graphs below (Figure 2 & 3) showing the age range of the Introductory course students (orange) compared to Intermediate course students (blue).
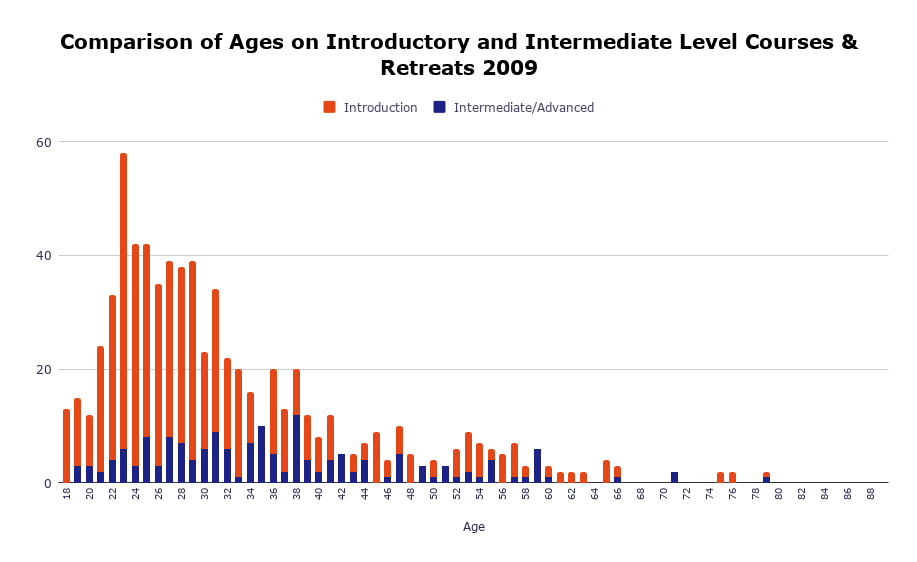
The average Year of Birth for students on our Intermediate Level Courses in 2009 and in 2019 was 1972, making the average Intermediate Level student 37 years old.
How many Men & Women take part in our courses & retreats?
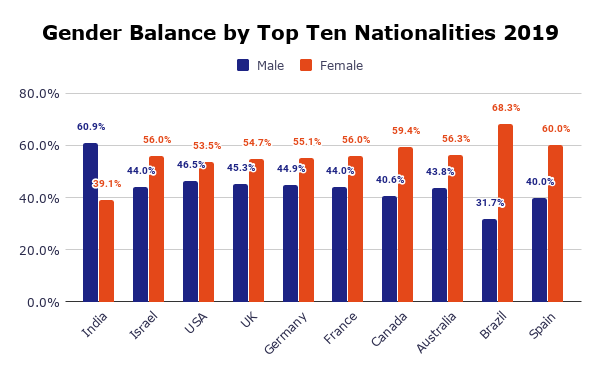
Over the last decade that we’ve been studying our records, the gender balance of students has been slowly evening out from 42% male and 58% female in 2009 to 46% male and 54% female in 2019. A significant part of this balancing is due to the increase of male students from India. India is the only country with a higher percentage of men (61%) compared with Indian women (39%). You can see this evening out in Figure 1 & Figure 2 below.
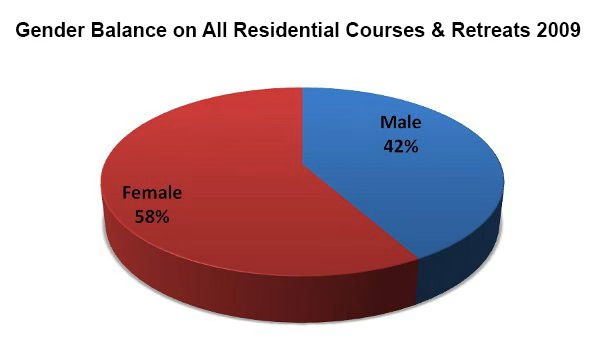
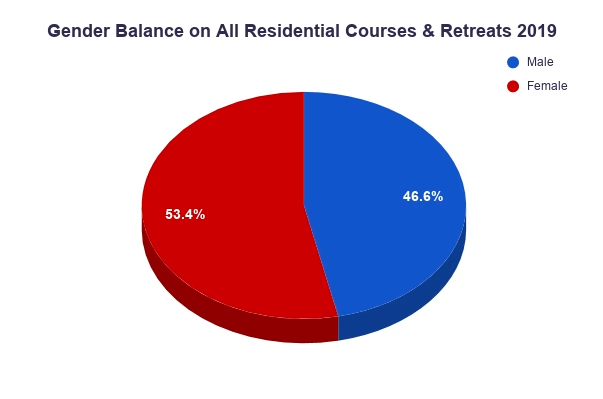
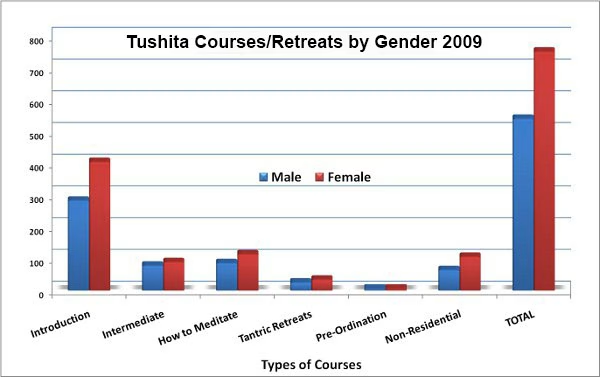
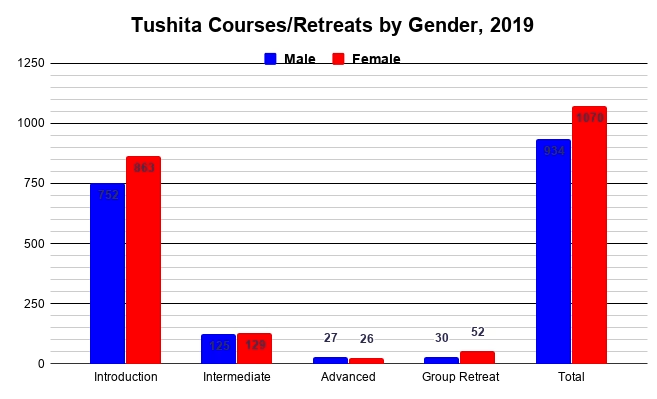
The graphs below (Figure 3 & 4) depict the breakdown of gender by course types in 2009 and 2019. Usually we have slightly more females than males in all of our courses, but this year we actually had slightly more males than females in our Advanced courses by one person.
The graph below (Figure 5) shows the gender balance of our top ten nationalities in 2019. Interestingly, we have more female students compared to male among every country with the sole exception of India. We hope to welcome even more Indian women (and men) in the years to come!